Load issue

Status
Not open for further replies.

Vishal Pai

Member
May 2, 2017
35
1
8
34
I am running fusionpbx on 8 core with 32 GB RAM with 210 Ext registered approx we have a peak of upto 30 calls but we have issue with load that CPU eat 500% but it remains constant with 500%. What would be the best possible way to debug it to identify the issue.

FusionPBX 4.5.8 & Switch 1.10.1 (64bit)
 

Adrian Fretwell

Well-Known Member
Aug 13, 2017
1,498
413
83
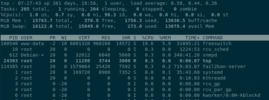
Try to find out what process is using the CPU, and if the usage is being reported correctly. The top utility is a good place to start. Top will normally show you an aggregation of CPU usage as shown below:
Screenshot from 2021-08-20 07-27-41.png

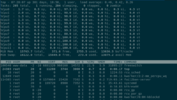
But if you press the 1 key while it is running, it will show you each CPU individually:
Screenshot from 2021-08-20 07-28-03.png

I can never remember what the mnemonics mean, so here is a reminder:

  • us: % of CPU used in user space (running user-spawned processes).
  • sy: % of CPU used in kernel space (running system processes).
  • ni: % CPU time used running processes with a user-defined priority (a specified nice value).
  • id: % CPU time used in the idle process.
  • wa: % CPU time used waiting on I/O from hardware. Example: waiting for a hard drive to finish reading data.
  • hi: % CPU time used processing hardware interrupts. Example: the network card (or any piece of hardware) interrupting the CPU to notify it that new data has arrived.
  • si: % CPU time used processing software interrupts. Example: a high priority service interrupting the CPU.
  • st: % CPU time used that was stolen from a virtual machine. The kernel needed to “steal” resources from a virtual machine in order to process the physical machine’s workload.

You can check that all your CPU cores have been properly recognised by the kernel using:
cat /proc/cpuinfo

Other utilities include, htop, systat, mpstat
 
Status
Not open for further replies.